An Audio Measurement Primer
Posted on / 23 Apr 2015
Making and weighting measurements of ongoing noise.
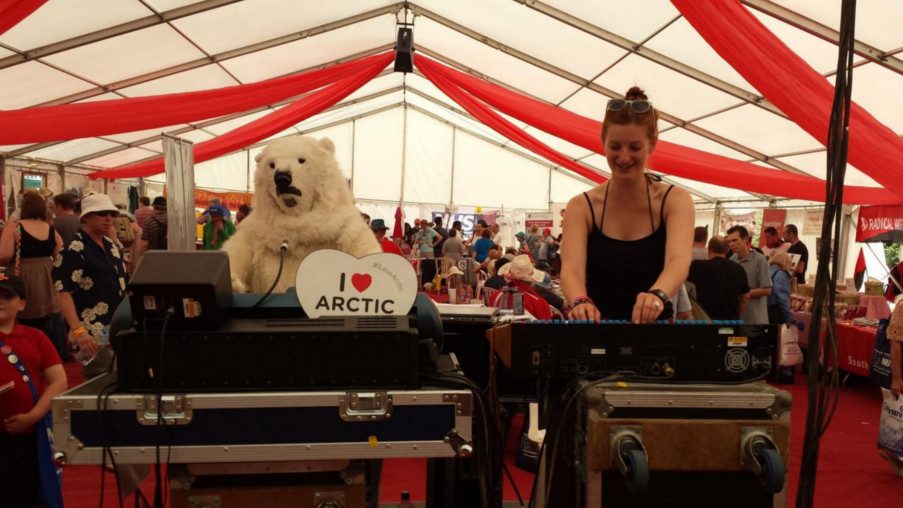
It is extremely common nowadays for festivals to be policed for noise by both the environmental health service, and the festival’s organisers. The licences for most festivals now include sections detailing the allowable noise levels at physical locations throughout the day. Decibel measurements give us hard figures which can be used to state our case when confronted by noise police, and also allow us to carefully control the dynamics of a stage’s output, in order to keep interest for festivalgoers throughout the day.
The human ear/brain system is a fantastically sensitive piece of measurement equipment. A normal healthy adult’s ears can hear (or at least sense) frequencies from between 20Hz to around 16kHz. Our response to frequency and amplitude are logarithmic in nature; at lower frequencies, we can easily hear the difference between say, 440Hz and 445Hz – in fact, this is quite pronounced. However, the same 5Hz difference when applied to say 12kHz is not as easy to hear. The same applies to our perception of pressure (amplitude) – it ranges, in ideal conditions, from adjustments of a few micropascals up to around 1 bar (1×10^11 micropascals!).
That only covers the purely mechanical portion of our perception – when you start to take into account the processing that our brain can do to what we hear, you begin to realise the power of this system as a whole. For example, we’re able to instantly localise the source of a sound at nearly any frequency and loudness, using both level differences between our ears, as well as phase and group delays. This happens without any conscious thought.
It’s very useful to know what kind of level our sound system is producing, beyond ‘too loud’ or ‘not loud enough’. For example, an incoming headline act might specify that your system be capable of reproducing undistorted material at 110dBC at the mix position. Meanwhile, you might not want to expose yourself to 100dBC for an entire day’s worth of festival – perhaps sculpting the level at the mix position throughout the day. In addition to this, it may be that the environmental health officer (or festival organiser) might not want to bother the neighbours too much – either out of common courtesy, or as a requirement of their licence. This would also require measurement (usually perimeter or offsite).
However, while our response to frequency and amplitude are generally logarithmic, they aren’t flat – we are more sensitive to some frequencies than others. This is compounded by the fact that our sensitivity to frequencies changes depending on their overall level. This was initially quantified by Harvey Fletcher and Wilden A Munson, whose names then became synonymous with the equal loudness contour they created, or the Fletcher-Munson curve.
 This curve demonstrates that at lower SPL, for a tone of 100Hz to be equivalent in apparent volume to a tone of 1kHz at 20dB, it would have to be played at approximately 46dB – quite a curve. Notice however that at higher SPLs, the curve flattens off – 100Hz need only be played at 105dB to seem equivalent to 1kHz at 100dB.
Because of this effect, our audio measurements employ a series of curves known as weighting curves. The most common of these are A, C, and Z weighting. Simply put, a measurement device with an A weighting will respond to lower-SPL input in the same way as a human ear. C weighting does the same, but for higher SPL input (remember how our perception of loudness evens out as overall SPL increases). Z weighting is a fancy way of saying ‘no weighting applied’, though it does include values for high- and low-pass filters on the measurement device to stop unscrupulous manufacturers using arbitrarily low low-pass filters, and high high-pass filters, as well as failing to specify between which frequencies the measurement was truly linear.

Choosing the correct weighting for a given situation is an important but simple decision. If the area where you’re measuring audio is going to be loud (for example, your mix position at a rock ‘n’ roll festival), then use a C weighting. If you’re taking perimeter or offsite measurements for noise control purposes, an A weighting is generally more suitable. If you’re taking objective measurements for the purposes of evaluating whether a particular speaker requires a service, a Z weighting may be your best bet.
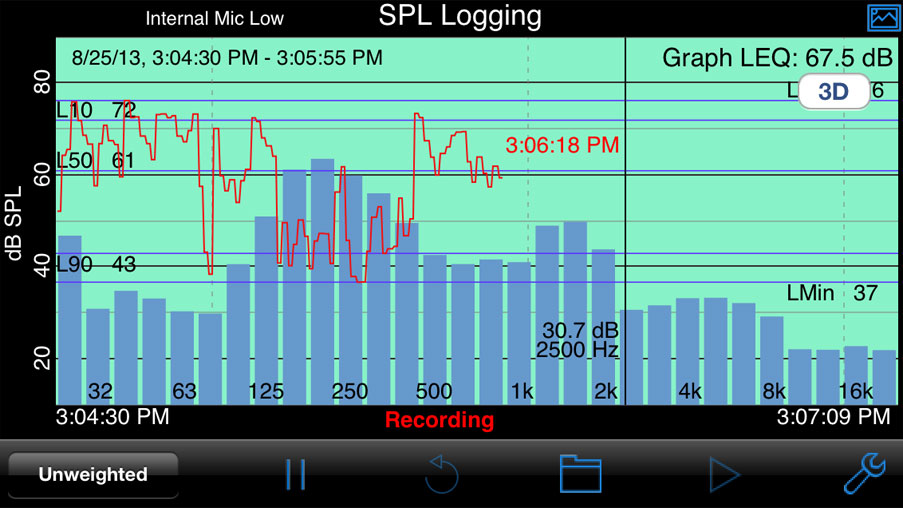
This talk of measurement is all very well and good, but so far we haven’t been able to account for an important part of any noise measurement – time. It should be obvious that while you can be exposed to a particular level for a certain amount of time to no ill effect, live music is not a constant volume; some songs are loud, others quiet. The band will stop for a few seconds between songs, and changeovers will also give a few minutes of lower SPL intensity. So if you take your instantaneous reading during a hard rock band’s ballad song, you could be three or five dB underneath the average level for that particular set!
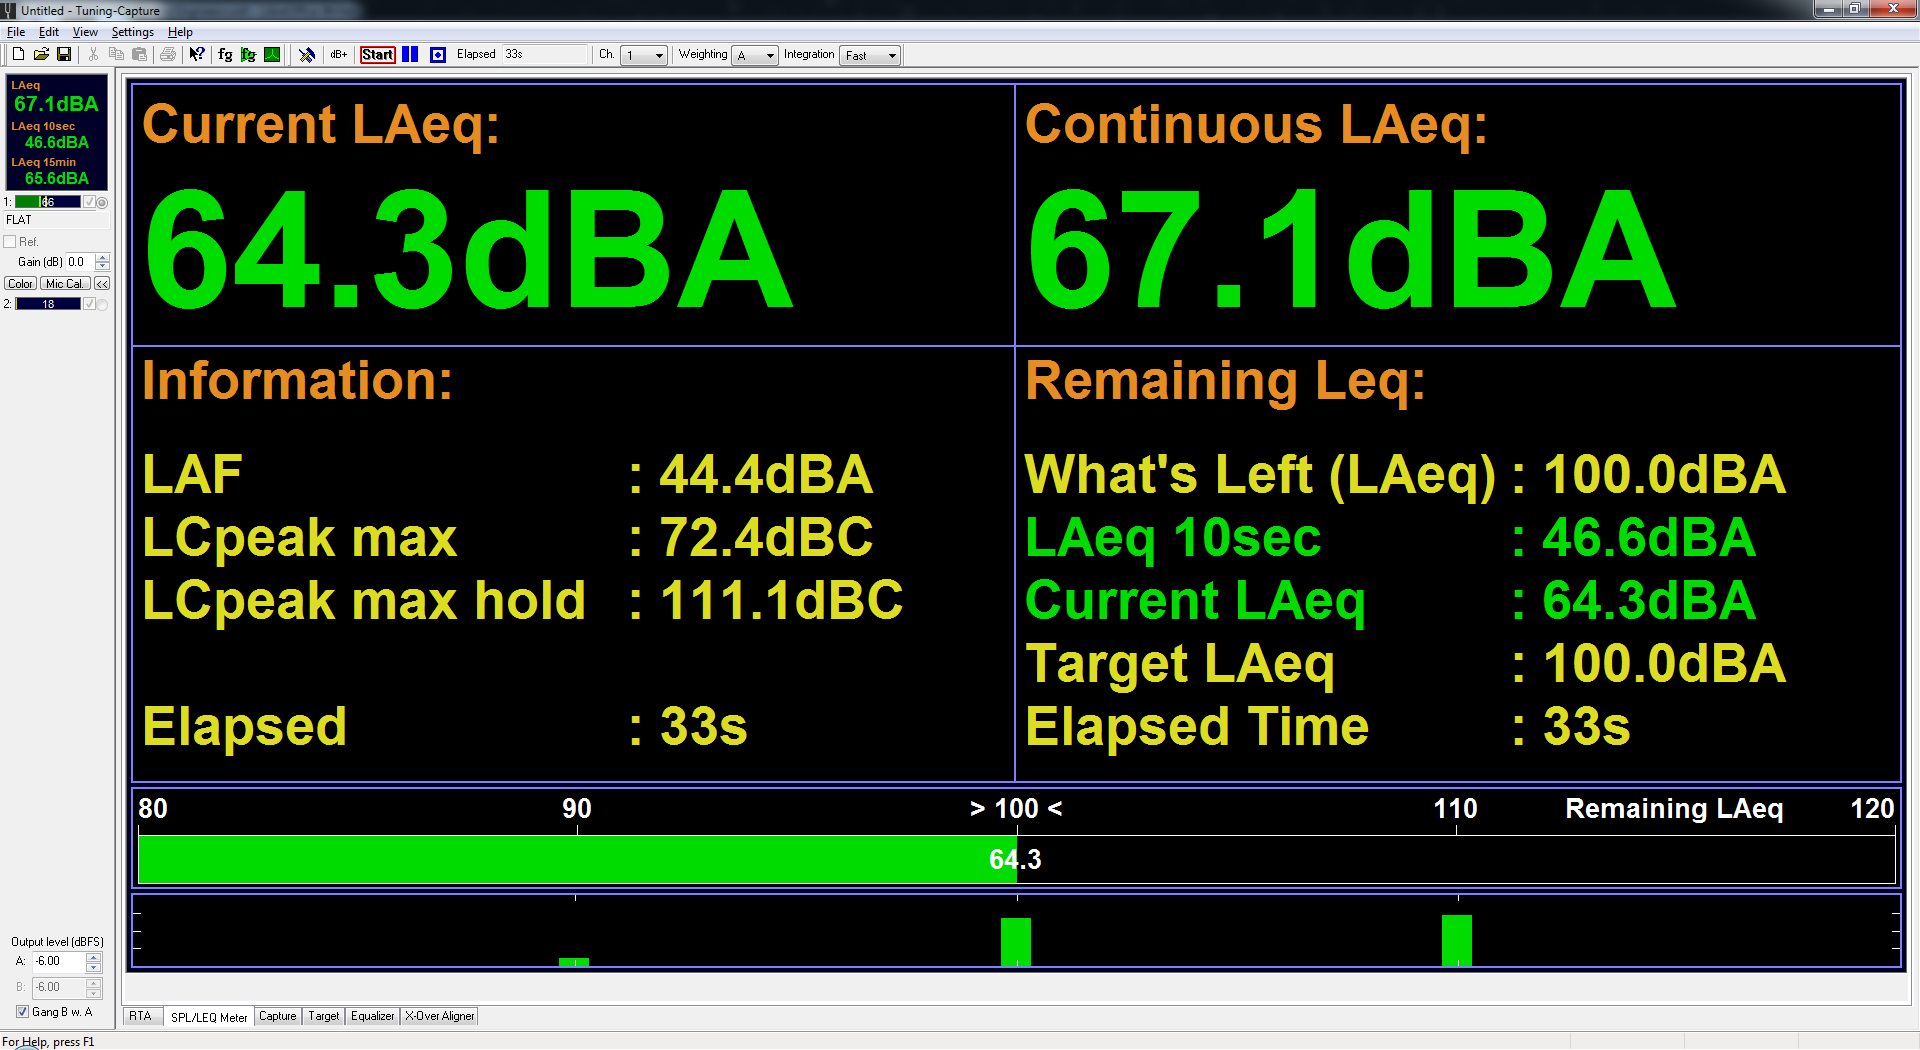
To help us keep dynamics in our reproduction of music, we use Leq – equivalent sound level. This is an average of sound levels over a period of time specified in the measurement. For example, a 15 minute Leq is a rolling average of audio levels over fifteen minutes. You may have noticed that this Leq doesn’t specify any weighting – you’re right, Leq doesn’t apply any weighting to incoming audio. However, we can use LAeq and LCeq (often also given as A/C-weighted Leq) to give more meaningful weighted measurements over time. It is very likely that you will be asked over the course of the festival to maintain perhaps 95dB 15 minute LAeq over the course of the day’s bands, with that restriction being raised with a new measurement of say 100dB 15 minute LAeq for the headline act’s set.
As with almost everything we use in this industry, the tools that we have available to us are very powerful, but require careful interpretation in order to get the most from them. Hopefully this brief primer on audio measurement methods will help you to make an informed choice at FoH in the future.
Related Products
Class 2 Calibrated Measurement System
£100.00 per day
£300.00 per week
Ask a Quick Question
"*" indicates required fields
News from our Blog
Gigs and Global Warming
Posted / 1 Dec 2019
Concert Noise Management
Posted / 11 Nov 2019
Knowledge Base Articles
Crew Comms for Festivals and Concerts
Posted / 25 Jan 2019
Introduction to Networking
Posted / 14 Jan 2018
Equipment for Hire
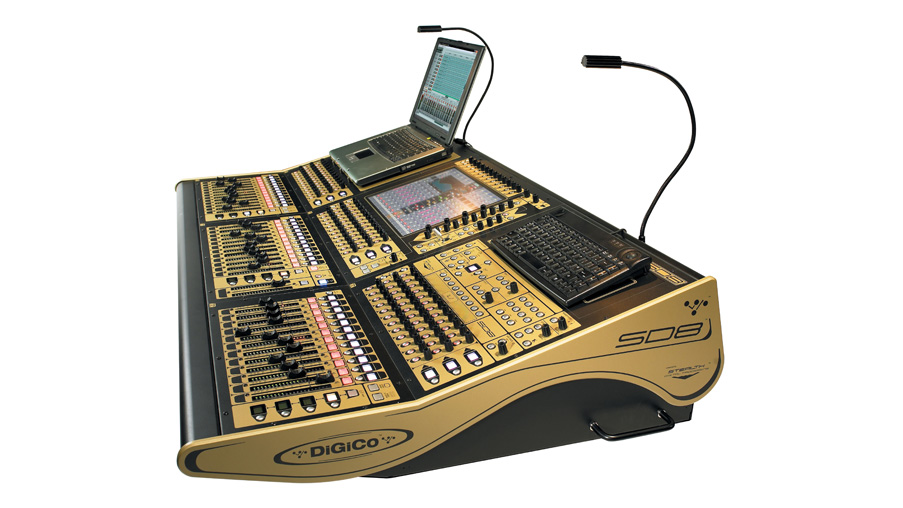
DiGiCo SD8 mixing console
£225.00 per day
£675.00 per week
Klark Technik DN9650 AES50 / MADI Network Bridge
£10.00 per day
£30.00 per week